Causality, Causal Inference, and role of Bayesian Networks in Causality with DoWhy and CausalImpact

Table of Contents
- Why Causal Inference is important?
- Observational Data and problems associated with it in Causal Inference
- Bayesian Networks
1. Dynamic Bayesian Networks - DoWhy: Introduction and 4 causal steps using DoWhy
1. Model a causal problem
2. Identify a target estimand under the model
3. Estimate causal effect based on the identified estimand
4. Refute the obtained estimate - CausalImpact
Why Causal Inference is important?
We have moved into the times in which we generate roughly 2.5 quintillion bytes of data per day. With the recent advances in IoT, this number will grow day by day. With the rise of data generation, we are highly motivated by Data-Driven Decision making. Data-Driven Decision making is really transforming the way we make decisions about healthcare, finance, industry, etc. When we think of data and try to use it for decision making we often come across Machine Learning. Machine Learning in a nutshell tries to discover the patterns in the data and use them to gain insights about the data which we can use to then make decisions about the problem. Correlational Machine Learning searches for patterns but some patterns may be spurious in nature. Machine Learning runs on the assumption that the training data is representative of the testing or deployment data. When this assumption is broken the Machine Learning model makes mistakes. For instance, a model with good accuracy in predicting numbers from handwritten numbers may not work properly if the numbers are placed at a different angle. This becomes even more serious when there are real-world problems involved. Assuming that we have a model predicting soil moisture level using years and years of historical data. A farmer who wants to check whether he should water his field during the days when temperature increases may use the model to find that the field should not be watered. In fact, with the heat increasing the soil moisture would reduce and the farmer should water the field. The model says not to water because whenever there was an increase in temperature the farmer always watered the field making the model learn that when temperature increases soil moisture also increases which is not the case. Thus we observe that conventional machine learning may not be the perfect choice for decision-making in scenarios where there are interventions that break the assumptions of the model.
For decision-making, we need to find the features that cause the outcome. Moreover, we need to find how the outcome would change if these features are changed. Causation thus can be defined as A causes B only if changes in A particularly causes changes B. Causal effect is then the magnitude by which B changes when A changes by a unit. Causal inference is the way to determine the effects of a particular type of intervention. Causal Inference faces some fundamental issues as follows:
- We cannot directly calculate the causal effect.
- We can only estimate the counterfactuals.
- Data alone is sometimes not enough for causal inference and domain knowledge is required in these cases.
Observational Data and problems associated with it
In the context of Causal Inference data can be classified into two types:
Randomized Control Trials (RCT)
- In RCT, treatment is assigned to individuals randomly
- RCTs are often small datasets.
- They have limited generalizability that is there is a risk if participants are not representative of the population.
- RCT can be unethical in many cases such as Healthcare.
- They are unconfounded by design and thus we don’t have to deal with confounding.
Observational Data
- Data is generated without the causal question in mind.
- Observational data is generally large and rich in nature.
- Observational data may represent the population.
- It may have a potential problem with hidden confounding.
In the real world, observational data is the kind of data we work with and there are two challenges with observational data as follows:
- Finding Causal Direction
From observational data, it is important to understand the causal direction. Certain data exploratory data analysis algorithms like Maximum likelihood estimation, causality algorithm, information geometric causal inference algorithm (D Janzing et al., 2014) help in this. (J Mitrovic et al., 2018) explains that if the conditional distribution from observational data is changed in the causal direction, it still makes sense. Although, if it is changed in an anti-causal direction it doesn’t make sense. Causal direction can be treated as a first phase to understand what is going on. Subject Matter Expertise is still required after this for us to make correct causal assumptions. - Confounding
Confounder: A confounder is a variable that influences both treatment and target variables. Confounding can limit the identifiability of causal effect.
Some of the proposed solutions for confounding are:
1. Match population using Propensity Score Matching
2. Obtain Confidence Intervals using Causal Forests, BART
3. Model relationships and encode Subject Matter Expertise using Bayesian Networks.
Bayesian Networks
Probabilistic models can be used to determine and quantify relationships between variables. This requires a large amount of data and tracking probabilities in fully conditional models may get cumbersome. The problem is usually that the domain information needed to completely define the dependency on random variables is missing. If available, it may be impractical to calculate the complete conditional probability. Thus, one intermediate method is to develop a model that retains a known conditional dependence between random and conditional variables, therefore bridging the gap between a completely conditional model and a fully conditionally independent model. Bayesian networks are a probabilistic graphical model that captures the known conditional dependency in a graphical model with directed edges. The conditional independence in the model is described by all missing connections. Bayesian networks are therefore less restrictive than the Naive Bayes classifier’s overall assumption of conditional independence, but more tractable than discarding all assumptions of conditional independence. Two popular graphical models are the Hidden Markov Model and Bayesian Networks. The Hidden Markov Model is a graphical model with undirected graphical edges that indicates that the graph is cycling (HMM). Bayesian networks are more restricted in that the diagram’s edges only point in one direction. As a result, cycles are not conceivable, and the graph is referred to as a directed acyclic graph (DAG). Undirected graphs are better at describing soft restrictions between random variables, but guided graphs are better at conveying causal connections between random variables. A probabilistic graphical model, such as the Bayesian network, enables the definition of a probabilistic model for a complicated issue by describing all of the conditional assumptions for independent variables, allowing for the existence of unknown variables.
Bayesian networks are used in various applications such as:
1. Automated Insight
2. Anomalous Patterns
3. Anomaly Detection
4. Time Series
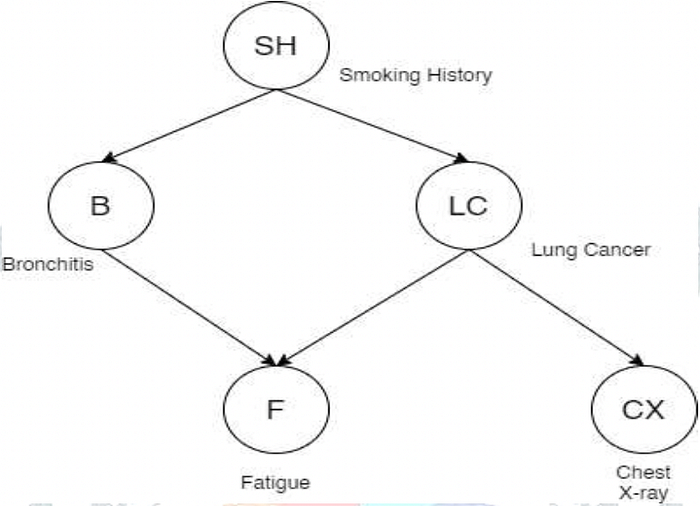
The idea of inference using Bayesian Networks is to figure out the set of graphs that represent the data to its best potential. Thus, it is learning the structure of a Directed Acyclic Graph (DAG) from data. Supposing we have tabular data on Lung cancer, Bronchitis, Fatigue, and Chest X-rays of a set of patients we might learn a Directed Acyclic Graph
There are two ways to learn the structure:
- Score based approach:
• DAGs are awarded scores depending on the data.
• Finally, we select the DAG with the highest score. - Constraint-based approach:
• We attempt to learn the DAG using conditional independencies based on the data.
• The DAG’s edges reflect causal dependency. Edges that are missing indicate independence.
Dynamic Bayesian Networks
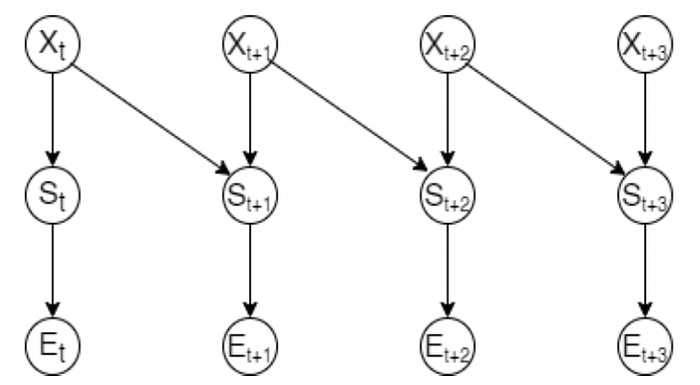
Any event is characterized by a certain time frame and it is not generally represented at a particular point of time or instance. The concept of time is extremely essential in the field of AI, Data Science for reasoning as it gives meaning to the data patterns over time. Similarly, almost every disease has time as a major factor in play. A disease cannot be represented in a single stage but has to be represented over multiple stages of time. Although Bayesian Networks succeed in the causal inference of variables, they fail to consider the temporal components. Dynamic Bayesian Networks represent a structure that changes or evolves dynamically over time. This model would allow users to track and update the system over time, as well as forecast future system behavior. Changing the nature of the static BN to model dynamically can then be viewed as adapting it to a dynamic model. A state-based model depicts the state of each variable at discrete time intervals; hence, a dynamic Bayesian network consists of a sequence of time slices, each of which displays the value of each variable at time t. Edges between multiple variables from different time slices show direction following the flow of time.
DoWhy: Introduction and 4 causal steps using DoWhy
“DoWhy” is a Python library that aims to spark causal thinking and analysis. DoWhy provides a principled four-step interface for causal inference that focuses on explicitly modeling causal assumptions and validating them as much as possible. The key feature of DoWhy is its state-of-the-art refutation API that can automatically test causal assumptions for any estimation method, thus making inference more robust and accessible to non-experts. DoWhy supports estimation of the average causal effect for the backdoor, front door, instrumental variable, and other identification methods, and estimation of the conditional effect (CATE) through an integration with the EconML library.
Installationpip install dowhy
Requirements
DoWhy requires the following packages:
- numpy
- scipy
- scikit-learn
- pandas
- networkx (for analyzing causal graphs)
- matplotlib (for general plotting)
- sympy (for rendering symbolic expressions)
Four Steps of Causal Inference using DoWhy
I am also attaching a practical example of Causal Inference using DoWhy in code snippets corresponding to each step.
Step 1: Model a causal problem
DoWhy provides an underlying causal graphical model for each situation. Each causal assumption has become explicit. This graph does not need to be complete; alternatively, you might provide a partial graph that indicates prior knowledge about some of the variables. DoWhy automatically considers the other factors as potential confounders.
Supported formats for specifying causal assumptions
- Graph: Provide a causal graph in either gml or dot format. Can be a text file or a string.
- Named variable sets: Instead of the graph, provide variable names that correspond to relevant categories, such as common causes, instrumental variables, effect modifiers, frontdoor variables, etc.
Step 2: Identify a target estimand under the model
DoWhy searches the causal graph for all feasible methods to discover a desired causal effect based on the graphical model. It employs graph-based criteria and do-calculus to discover possible expressions that might identify the causal impact.
Supported identification criteria
- Back-door criterion
- Front-door criterion
- Instrumental Variables
- Mediation (Direct and indirect effect identification)
Step 3. Estimate causal effect based on the identified estimand
DoWhy supports approaches that use back-door criteria as well as instrumental factors. It also includes a non-parametric confidence interval and a permutation test for determining the statistical significance of the estimated value.
Supported estimation methods
Methods based on estimating the treatment assignment
- Propensity-based Stratification
- Propensity Score Matching
- Inverse Propensity Weighting
Methods based on estimating the outcome model
- Linear Regression
- Generalized Linear Models
Methods based on the instrumental variable equation
- Binary Instrument/Wald Estimator
- Two-stage least squares
- Regression discontinuity
Methods for front-door criterion and general mediation
- Two-stage linear regression
Some of the methods are explained in Causal Inference Tutorial by Amit Sharma here.
Step 4. Refute the obtained estimate
A fundamental advantage of utilizing DoWhy is having access to different refutation techniques for validating an effect estimate from a causal estimator.
Supported refutation methods
Add Random Common Cause: Does the estimation method change its estimate after we add an independent random variable as a common cause to the dataset? (It should not)
Placebo Treatment: What happens to the estimated causal effect when we replace the true treatment variable with an independent random variable? (the effect should go to zero)
Dummy Outcome: What happens to the estimated causal effect when we replace the true outcome variable with an independent random variable? (The effect should go to zero)
Simulated Outcome: What happens to the estimated causal effect when we replace the dataset with a simulated dataset based on a known data-generating process closest to the given dataset? (It should match the effect parameter from the data-generating process)
Add Unobserved Common Causes: How sensitive is the effect estimate when we add an additional common cause (confounder) to the dataset that is correlated with the treatment and the outcome? (It should not be too sensitive)
Data Subsets Validation: Does the estimated effect change significantly when we replace the given dataset with a randomly selected subset? (It should not)
Bootstrap Validation: Does the estimated effect change significantly when we replace the given dataset with bootstrapped samples from the same dataset? (It should not)
CausalImpact: Introduction
It is an R package for causal inference using Bayesian structural time-series models. This R package implements an approach to estimating the causal effect of a designed intervention on a time series. For example, how many additional daily clicks were generated by an advertising campaign? Answering a question like this can be difficult when a randomized experiment is not available. Given a response time series (e.g., clicks) and a set of control time series (e.g., clicks in non-affected markets or clicks on other sites), the package constructs a Bayesian structural time-series model. This model is then used to try and predict the counterfactual, i.e., how the response metric would have evolved after the intervention if the intervention had never occurred.
There is also a python version for causalimpact with the name pycausalimpact.
Installationpip install pycausalimpact
Requirements
- python{2.7, 3.6, 3.7, 3.8}
- numpy
- scipy
- statsmodels
- matplotlib
- jinja2
I am attaching a fun example of How Elon Musk’s smoking on Joe Rogan’s show had a Causal Effect on Tesla Stock in the next two days
Feel free to visit the notebook here
I have also covered the applications of Causal Inference in healthcare and Finance using methods such as Bayesian Networks and Granger’s Causality in my survey paper. If you are interested please visit this page.
References
- https://microsoft.github.io/dowhy/readme.html
- https://www.youtube.com/watch?v=LALfQStONEc&ab_channel=MicrosoftResearch
- https://www.youtube.com/watch?v=O5-vbOWQhLo&ab_channel=DataCouncil
- https://www.researchgate.net/publication/356603136_An_Overview_of_Causal_Inference_and_its_Applications_in_Health-care_and_Finance_using_methods_such_as_Bayesian_Networks_and_Granger's_Causality
- https://pypi.org/project/pycausalimpact/
- https://google.github.io/CausalImpact/CausalImpact.html#printing-a-summary-table
- https://arxiv.org/abs/1402.2499
- https://arxiv.org/abs/1804.04622
Thank You!
I hope you like this article on Causal Inference. This was just to give a short introduction to what it is and how we can implement it using simple examples. The actual theory goes in a lot of depth and I encourage reading various research papers if you want to understand this in-depth. Here is the list of top research papers on Causal Inference!
Here are my social handles :)
